Arc Gauges
![]()
Adding Arc Gauges to Your Solution
Enhancing your user interface with Arc Gauges offers a unique visual method for displaying your data, particularly when dealing with percentage-formatted data or data with defined minimum and maximum values.
Examples
![]()
Create an Arc Gauge to add to the Driver Inspector Widget
- In your code editor, navigate to objects -> dashui -> templates
- Find the Entity you want to add an Arc Gauge for
- We will add an Arc Gauge to the Driver Entity representing MPH and RPM
Add a new file named driverMphArcGaugeInspectorWidget.json and driverMphArcGaugeInspectorWidgetTemplate.json
- You will need both files for each Arc Gauge you want to display
Copy the code below into your driverMphArcGaugeInspectorWidget.json file
{
"kind": "template",
"name": "ugottaride:driverMphArcGaugeInspectorWidget",
"target": "*",
"props": {
"maxValue":  200,
"minValue": 0,
"size": 160,
"valueFontSize": 30,
"thickness": 12,
"valueQuery": "FROM entities(ugottaride:driver) FETCH count",
"valueAlias": "count",
"hideRange": false,
"format": "#"
},
"preprocess": "$ ~> | $.'@sources' | {'default': [{'type': 'uqe', 'query': $props.valueQuery, 'useTimeRange': true},{'type': 'expr', 'expr': 'rows[0].' & $props.valueAlias}]} |\n  ~> | children[0].'@data' | $merge($each($props, function($v, $k) {({$k: {'type': 'value', 'value': $v}})})) |\n  ~> | style | {'width': $props.size} |\n  ~> | children[0] | {'width': $props.size, 'position': 'relative', 'height': $props.size} |\n  ~> | children[1].style | {'height': $props.size, 'width': $props.size, 'fontSize': $props.valueFontSize} |\n  ~> | children[1] | {'$children': '$data.value[0] = null ? \"- / -\" :  $formatNumber($data.value[0],\"' & $props.format & '\")'} |\n  ~> | children[2].style | {'margin-top': $min([0, -($props.size - 40) / 8]) }  |\n  ~> | children[2].children[0] | {'children': $props.hideRange ? '' : $props.minValue} |\n  ~> | children[2].children[2] | {'children': $props.hideRange ? '' : $props.maxValue} |\n  ~> | children[2].children[1] | {'children': $props.unit} |",
"element": {
"@type": "html.div",
"style": {
  "width": 160,
  "position": "relative"
},
"@sources": {
  "default": [{
    "type": "uqe",
    "useTimeRange": true
  },
    {"type": "expr", "expr": "rows[0].count"}
  ]
},
"children": [
  {
    "@type": "svg",
    "@data": {
      "value": {
        "from": "default"
      }
    },
    "$children": "($value:= $data.value[0] = null ? 0 : $data.value[0]; $pi := 3.1415926535897932384626; $product := function($a, $b) { $a * $b }; $factorial := function($n) { $n = 0 ? 1 : $reduce([1..$n], $product) }; $sin := function($x){ /* define sine in terms of cosine */   $cos($x - $pi/2) }; $cos := function($x){ $x > $pi ? $cos($x - 2 * $pi) : $x < -$pi ? $cos($x + 2 * $pi) : $sum([0..12].($power(-1, $) * $power($x, 2*$) / $factorial(2*$))) }; $p2c:=function($cx, $cy, $phi, $r){ $string($cx + $r * $cos($phi / 180 * $pi)) & ' ' &  $string($cy + $r * $sin($phi / 180 * $pi)) }; $c:=$data.size[0] / 2; $r:=$c - 1.5 * $data.thickness[0]; $str := function($arr) {$arr.$string($) ~> $join(' ')}; $arc := function($phi, $dphi) {    'M' & $p2c($c, $c, $phi, $r)     & 'A' & $str([$r, $r, 0, $dphi > 180 ? 1 : 0, 1, $p2c($c, $c, $phi + $dphi, $r)], ' ') };$colorIndex := $max([$reduce($data.colorThresholds, function($lastIndex, $t, $index){($value < $t and $lastIndex > $index) ? $index : $lastIndex}, $count($data.colorThresholds)) - 1, 0]); $solidPhi := 300 * $max([0, $min([($value - $data.minValue[0]) / ($data.maxValue[0] - $data.minValue[0]), 1])]); {'@type': 'svg', 'width': $data.size[0], 'height': $data.size[0], 'children': [{'phi':300, 'op': 0.25}, {'phi':$solidPhi, 'op': 0.9}].{     '@type': 'svg.path',     'd': $arc(120, $.phi),     'stroke': $data.color[$colorIndex],     'stroke-width': $data.thickness[0],     'fill': 'none',     'stroke-opacity': $.op,     'stroke-linecap': 'round' }})"

  },
  {
    "@type": "html.div",
    "@data": {
      "value": {
        "from":  "default"
      }
    },
    "$children": "$data.value[0] = null ? 'NULL' :  $formatNumber($data.value[0],'#')",
    "style": {
      "top": 0,
      "left": 0,
      "height": 160,
      "font-size": 20,
      "position": "absolute",
      "display": "flex",
      "align-items": "center",
      "justify-content": "center"
    }
  },
  {
    "@type": "html.div",
    "style": {"display":  "flex", "justify-content": "space-between", "padding-left":  12, "padding-right":  12},
    "children": [
    {
      "@type":  "html.div",
      "children": "min"
    },
      {
        "@type": "html.div",
        "children": ""
      },
      {
        "@type":  "html.div",
        "children": "max"
      }
    ]
  }
]
}
}
Copy the code below into your driverMphArcGaugeInspectorWidgetTemplate.json file
{
"kind": "template",
"name": "ugottaride:driverMphArcGaugeInspectorWidgetTemplate",
"target": "*",
"props": {
"title": "Miles per Hour",
"maxValue": 200,
"minValue": 0,
"color": [
  "green",
  "#bebf02",
  "red"
],
"colorThresholds": [0,76,100],
"format": "#",
"size": 160,
"headingStyle": {},
"valueFontSize": 30,
"thickness": 12,
"fetchValue": "metrics(ugottaride:miles_per_hour, ugottaride).value"
},
"preprocess": "$ ~> | elements[0].elements[0].style | $props.headingStyle | ~> | elements[0].elements[0] | {'children': $props.title, 'style': $merge([$.style, {'width': $props.size}])} |\n  ~> | elements[0].elements[1] | $merge([\n     $sift($props, function($v, $k) {$k in ['minValue', 'maxValue', 'color', 'colorThresholds', 'size', 'valueFontSize', 'thickness', 'format', 'unit', 'hideRange']}),\n      {'valueQuery': 'FROM {{topology}} FETCH v:' & $props.fetchValue}])|",

"element": {
"instanceOf": "html",
"style": {
  "display": "flex",
  "flex-direction": "column",
  "align-items": "center",
  "justify-content": "center"
 },
"elements": [
  {
    "instanceOf": "v1plus",
    "preprocess": "$ ~> | $ | {'valueQuery': $replace(valueQuery, '{{topology}}', $props.topology)} |",
    "elements": [
      {
        "@type": "html.div",
        "style": { "text-align": "center", "font-size": 14, "width": 160 },
        "children": ""
      },
      {
        "@type": "ugottaride:driverMphArcGaugeInspectorWidget",
        "valueAlias": "v",
        "valueQuery": "FROM {{topology}} FETCH count"
      }
    ]
  }
]
}
}
![]()
Add MPH Arc Gauge to the Driver Inspector Widget
In the driverInspectorWidget json file, you will add a new column to display the MPH Arc Gauge as seen on the lines between the start and end tags.
            {
  "kind": "template",
  "name": "ugottaride:driverInspectorWidget",
  "target": "ugottaride:driver",
  "view": "default",
  "element": {
    "instanceOf": "elements",

    "elements": [
      {
        "title": "Properties",
        "instanceOf": {
          "name": "inspectorWidget"
        },
        "elements": {
          "instanceOf": {
            "name": "properties"
          },
          "elements": [
            {
              "label": {
                "instanceOf": "text",
                "content": "Driver ID:"
              },
              "value": {
                "instanceOf": "string",
                "path": "attributes(driverid)"
              }
            },
            {
              "label": {
                "instanceOf": "text",
                "content": "First Name:"
              },
              "value": {
                "instanceOf": "string",
                "path": "attributes(first_name)"
              }
            },
            {
              "label": {
                "instanceOf": "text",
                "content": "Last Name:"
              },
              "value": {
                "instanceOf": "string",
                "path": "attributes(last_name)"
              }
            },
            {
              "label": {
                "instanceOf": "text",
                "content": "Driver Name:"
              },
              "value": {
                "instanceOf": "string",
                "path": "attributes(display_name)"
              }
            },

            {
              "label": {
                "instanceOf": "text",
                "content": "Count of Ride Assignments:"
              },
              "value": {
                "instanceOf": "count",
                "path": "out(common:has).to(ugottaride:ride_assign)"
              }
            }
          ]
        }
      },
      <START>
      {
        "instanceOf": "ugottaride:driverMphArcGaugeInspectorWidgetTemplate"
      },
      <END>
      {
        "instanceOf": "html",
        "style": {
          "display": "flex",
          "flex-direction": "column",
          "align-items": "center",
          "justify-content": "center",
          "height": 34
        }
      },
      {
        "instanceOf": "ugottaride:driverRpmArcGaugeInspectorWidgetTemplate"
      }
    ]
  }
}![]()
Create a MPH Arc Gauge to add to the Driver Detail List
- In your code editor, navigate to objects -> dashui -> templates
- Find the Entity you want to add an Arc Gauge for
- We will add an Arc Gauge to the Driver Entity representing MPH and RPM
Add a new file named driverMphArcGauge.json and driverMphArcGaugeTemplate.json
- You will need both files for each Arc Gauge you want to display
Copy the code below into your driverMphArcGauge.json file
        {
"kind": "template",
"name": "ugottaride:driverMphArcGauge",
"target": "*",
"props": {
"maxValue":  200,
"minValue": 0,
"size": 200,
"valueFontSize": 36,
"thickness": 12,
"valueQuery": "FROM entities(ugottaride:driver) FETCH count",
"valueAlias": "count",
"hideRange": false,
"format": "#"
},
"preprocess": "$ ~> | $.'@sources' | {'default': [{'type': 'uqe', 'query': $props.valueQuery, 'useTimeRange': true},{'type': 'expr', 'expr': 'rows[0].' & $props.valueAlias}]} |\n  ~> | children[0].'@data' | $merge($each($props, function($v, $k) {({$k: {'type': 'value', 'value': $v}})})) |\n  ~> | style | {'width': $props.size} |\n  ~> | children[0] | {'width': $props.size, 'position': 'relative', 'height': $props.size} |\n  ~> | children[1].style | {'height': $props.size, 'width': $props.size, 'fontSize': $props.valueFontSize} |\n  ~> | children[1] | {'$children': '$data.value[0] = null ? \"- / -\" :  $formatNumber($data.value[0],\"' & $props.format & '\")'} |\n  ~> | children[2].style | {'margin-top': $min([0, -($props.size - 40) / 8]) }  |\n  ~> | children[2].children[0] | {'children': $props.hideRange ? '' : $props.minValue} |\n  ~> | children[2].children[2] | {'children': $props.hideRange ? '' : $props.maxValue} |\n  ~> | children[2].children[1] | {'children': $props.unit} |",
"element": {
"@type": "html.div",
"style": {
  "width": 200,
  "position": "relative"
},
"@sources": {
  "default": [{
    "type": "uqe",
    "useTimeRange": true
  },
    {"type": "expr", "expr": "rows[0].count"}
  ]
},
"children": [
  {
    "@type": "svg",
    "@data": {
      "value": {
        "from": "default"
      }
    },
    "$children": "($value:= $data.value[0] = null ? 0 : $data.value[0]; $pi := 3.1415926535897932384626; $product := function($a, $b) { $a * $b }; $factorial := function($n) { $n = 0 ? 1 : $reduce([1..$n], $product) }; $sin := function($x){ /* define sine in terms of cosine */   $cos($x - $pi/2) }; $cos := function($x){ $x > $pi ? $cos($x - 2 * $pi) : $x < -$pi ? $cos($x + 2 * $pi) : $sum([0..12].($power(-1, $) * $power($x, 2*$) / $factorial(2*$))) }; $p2c:=function($cx, $cy, $phi, $r){ $string($cx + $r * $cos($phi / 180 * $pi)) & ' ' &  $string($cy + $r * $sin($phi / 180 * $pi)) }; $c:=$data.size[0] / 2; $r:=$c - 1.5 * $data.thickness[0]; $str := function($arr) {$arr.$string($) ~> $join(' ')}; $arc := function($phi, $dphi) {    'M' & $p2c($c, $c, $phi, $r)     & 'A' & $str([$r, $r, 0, $dphi > 180 ? 1 : 0, 1, $p2c($c, $c, $phi + $dphi, $r)], ' ') };$colorIndex := $max([$reduce($data.colorThresholds, function($lastIndex, $t, $index){($value < $t and $lastIndex > $index) ? $index : $lastIndex}, $count($data.colorThresholds)) - 1, 0]); $solidPhi := 300 * $max([0, $min([($value - $data.minValue[0]) / ($data.maxValue[0] - $data.minValue[0]), 1])]); {'@type': 'svg', 'width': $data.size[0], 'height': $data.size[0], 'children': [{'phi':300, 'op': 0.25}, {'phi':$solidPhi, 'op': 0.9}].{     '@type': 'svg.path',     'd': $arc(120, $.phi),     'stroke': $data.color[$colorIndex],     'stroke-width': $data.thickness[0],     'fill': 'none',     'stroke-opacity': $.op,     'stroke-linecap': 'round' }})"

  },
  {
    "@type": "html.div",
    "@data": {
      "value": {
        "from":  "default"
      }
    },
    "$children": "$data.value[0] = null ? 'NULL' :  $formatNumber($data.value[0],'#')",
    "style": {
      "top": 0,
      "left": 0,
      "height": 200,
      "font-size": 24,
      "position": "absolute",
      "display": "flex",
      "align-items": "center",
      "justify-content": "center"
    }
  },
  {
    "@type": "html.div",
    "style": {"display":  "flex", "justify-content": "space-between", "padding-left":  12, "padding-right":  12},
    "children": [
    {
      "@type":  "html.div",
      "children": "min"
    },
      {
        "@type": "html.div",
        "children": ""
      },
      {
        "@type":  "html.div",
        "children": "max"
      }
    ]
  }
]
}
}
Copy the code below into your driverMphArcGaugeTemplate.json file
{
"kind": "template",
"name": "ugottaride:driverMphArcGaugeTemplate",
"target": "*",
"props": {
"title": "",
"maxValue": 200,
"minValue": 0,
"color": [
  "green",
  "#bebf02",
  "red"
],
"colorThresholds": [0,76,100],
"format": "#",
"size": 200,
"headingStyle": {},
"valueFontSize": 36,
"thickness": 12,
"fetchValue": "metrics(ugottaride:miles_per_hour, ugottaride).value"
},
"preprocess": "$ ~> | elements[0].elements[0].style | $props.headingStyle | ~> | elements[0].elements[0] | {'children': $props.title, 'style': $merge([$.style, {'width': $props.size}])} |\n  ~> | elements[0].elements[1] | $merge([\n     $sift($props, function($v, $k) {$k in ['minValue', 'maxValue', 'color', 'colorThresholds', 'size', 'valueFontSize', 'thickness', 'format', 'unit', 'hideRange']}),\n      {'valueQuery': 'FROM {{topology}} FETCH v:' & $props.fetchValue}])|",

"element": {
"instanceOf": "html",
"style": {
  "display": "flex",
  "flex-direction": "column",
  "align-items": "center",
  "justify-content": "center"
 },
"elements": [
  {
    "instanceOf": "v1plus",
    "preprocess": "$ ~> | $ | {'valueQuery': $replace(valueQuery, '{{topology}}', $props.topology)} |",
    "elements": [
      {
        "@type": "html.div",
        "style": { "text-align": "center", "font-size": 14, "width": 200 },
        "children": ""
      },
      {
        "@type": "ugottaride:driverMphArcGauge",
        "valueAlias": "v",
        "valueQuery": "FROM {{topology}} FETCH count"
      }
    ]
  }
]
}
}
![]()
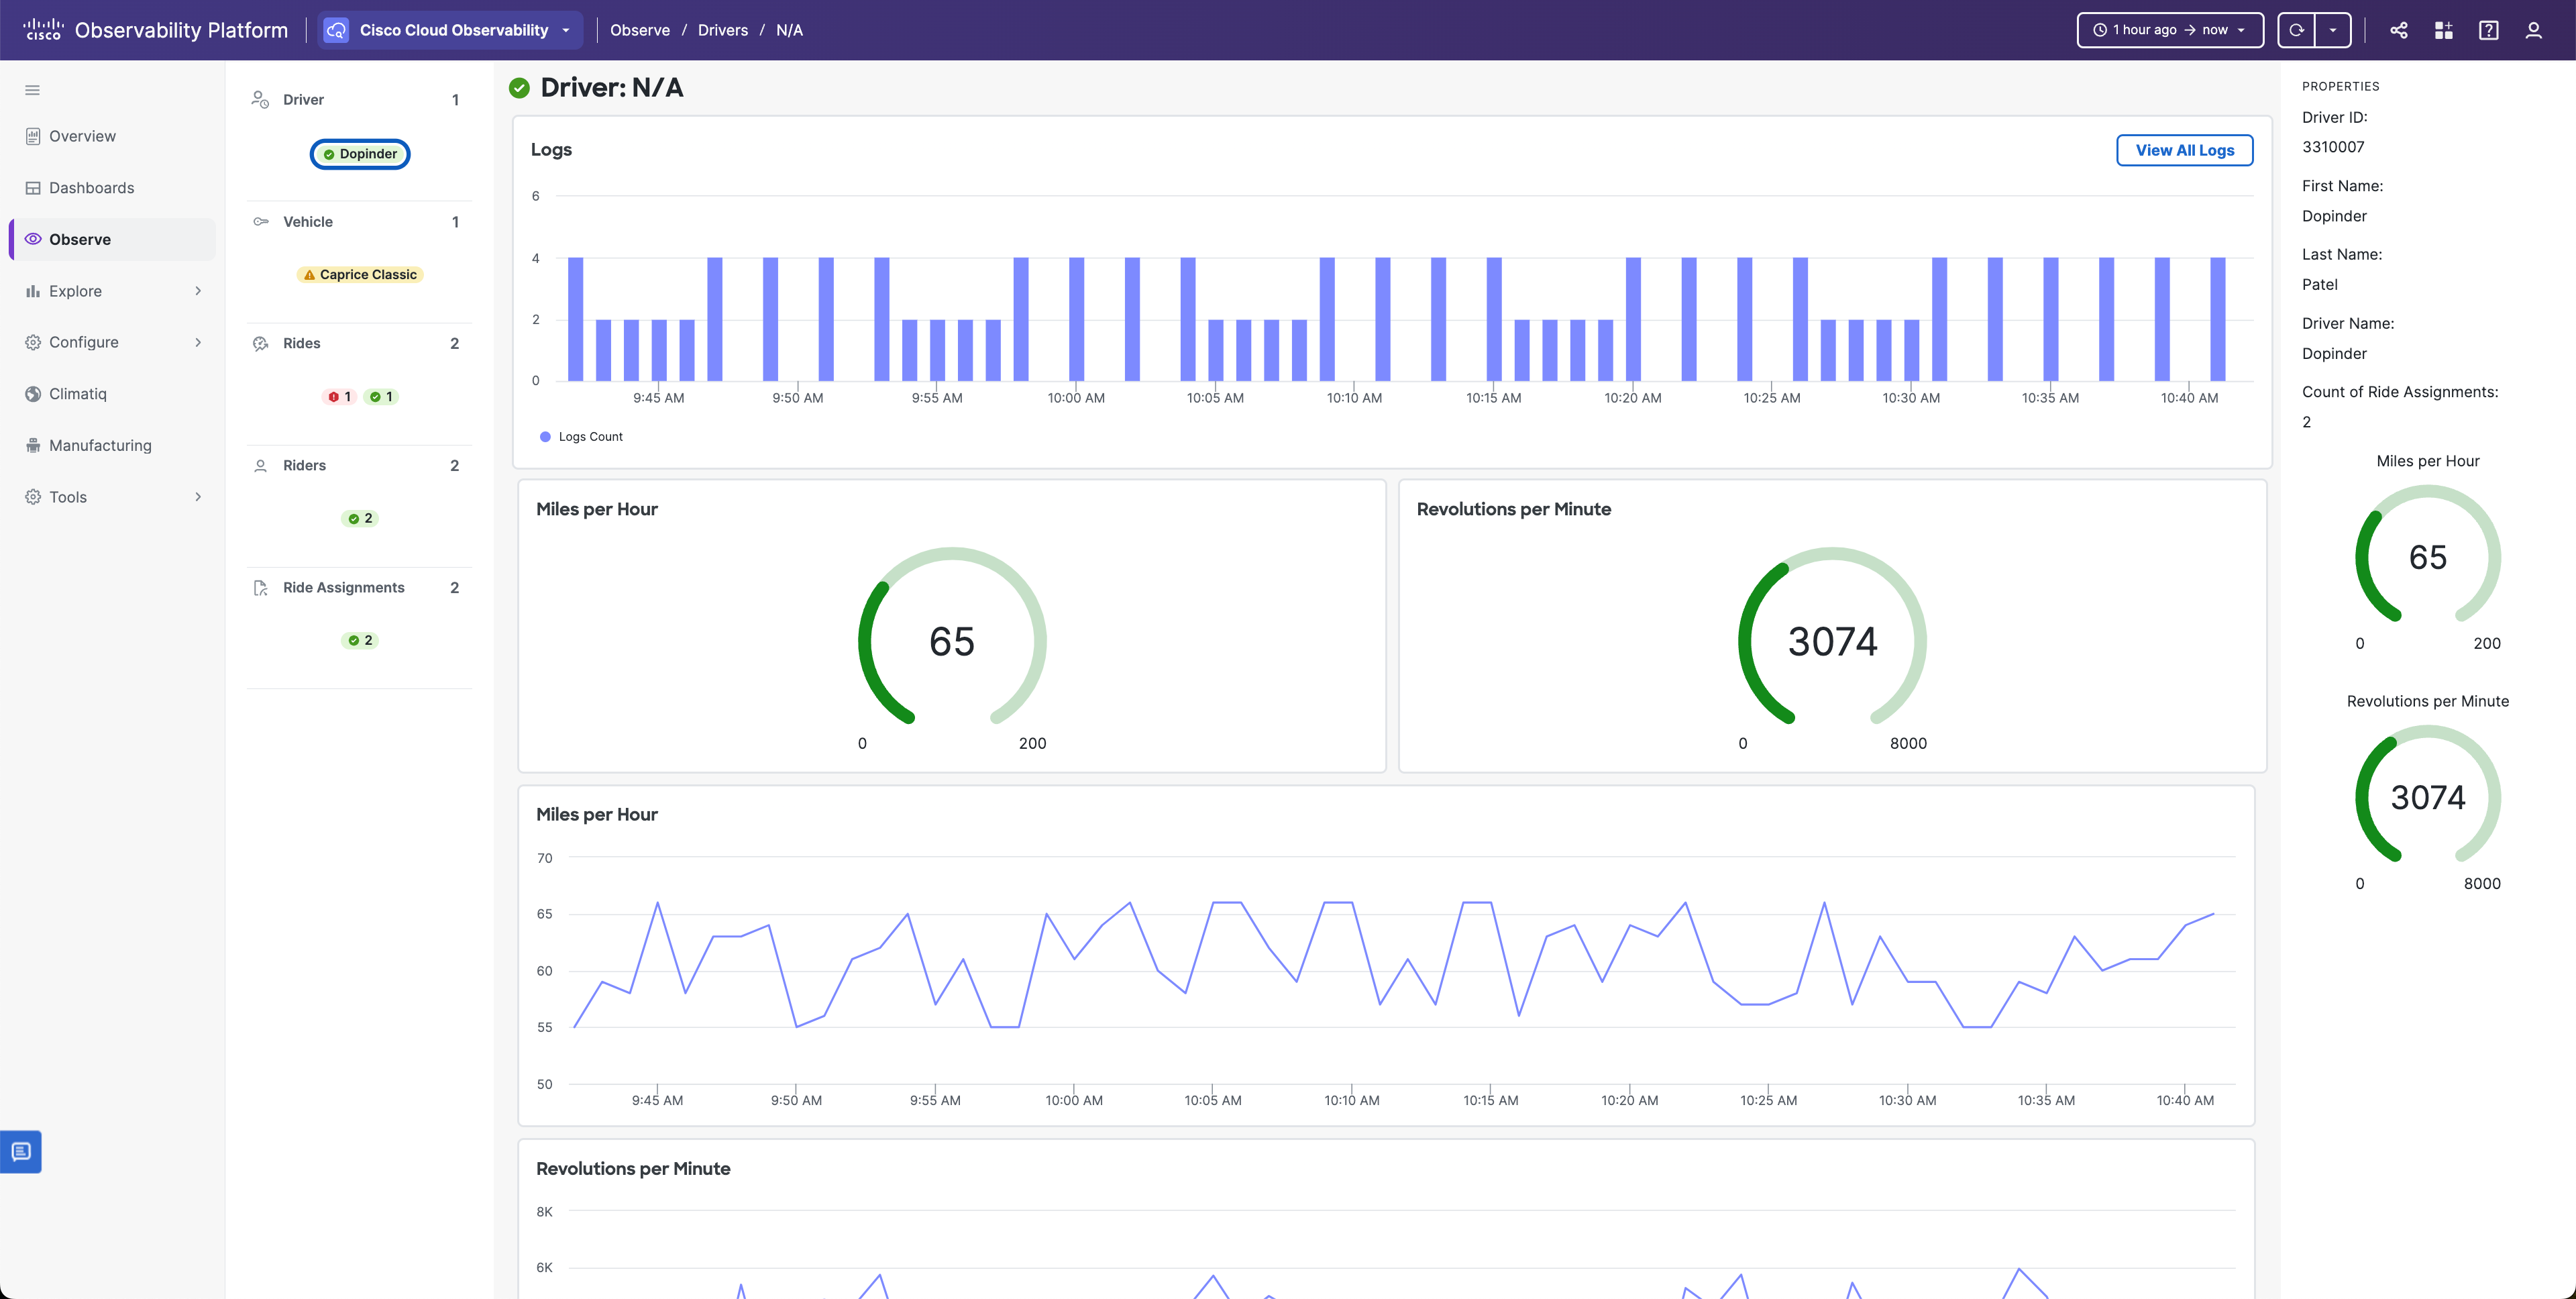
Add MPH Arc Gauge to the Driver Detail List
In the driverDetailList json file, you will add a new column to display the MPH Arc Gauge as seen on the lines between the start and end tags. Please note that this file also includes the Arc Gauge for RPM
{
  "kind": "template",
  "name": "ugottaride:driverDetailsList",
  "view": "default",
  "target": "ugottaride:driver",
  "element": {
    "style": {
      "gap": "5px",
      "width": "100%",
      "height": "calc(200%)",
      "margin": "5px 5px 1%",
      "display": "flex",
      "flexDirection": "column"
    },

    "elements": [
      {
        "style": {
          "display": "flex",
          "margin-top": "3px",
          "flexDirection": "row",
          "margin-bottom": "5px"
        },

        "instanceOf": {
          "name": "logsWidget"
        },
        "source": "derived_metric"
      },
<START>
      {
        "element": {
          "style": {
            "display": "flex",
            "margin-top": "3px",
            "flexDirection": "row",
            "margin-bottom": "5px"
          },

          "elements": [
            {
              "instanceOf": "card",
              "props": {
                "title": "Miles per Hour",
                "style": {
                  "width": "50%",
                  "margin-left": "5px",
                  "margin-right": "5px"
                }
              },
              "elements": [
                {
                  "instanceOf": "ugottaride:driverMphArcGaugeTemplate"
                }
              ]
            },

            {
              "instanceOf": "card",
              "props": {
                "title": "Revolutions per Minute",
                "style": {
                  "width": "50%",
                  "margin-left": "5px",
                  "margin-right": "5px"
                }
              },
              "elements": [
                {
                  "instanceOf": "ugottaride:driverRpmArcGaugeTemplate"
                }
              ]
            }
          ],
          "instanceOf": "html"
        },
        "instanceOf": "html"
      },
<END>
      {
        "props": {
          "title": "Miles per Hour",
          "style": {
            "display": "flex",
            "width": "98.7%",
            "margin-left": "5px",
            "margin-right": "5px",
            "margin-bottom": "5px"
          }
        },
        "elements": [
          {
            "instanceOf": "cartesian",
            "props": {
              "style": {
                "height": 250
              }
            },
            "children": [
              {
                "props": {
                  "name": "Miles per Hour",
                  "title": "Miles per Hour"
                },
                "metric": {
                  "name": "ugottaride:miles_per_hour",
                  "source": "ugottaride",
                  "y": {
                    "type": "value"
                  }
                },
                "type": "LINE"
              }
            ]
          }
        ],

        "instanceOf": "card"
      },

      {
        "props": {
          "title": "Revolutions per Minute",
          "style": {
            "display": "flex",
            "width": "98.7%",
            "margin-left": "5px",
            "margin-right": "5px",
            "margin-bottom": "5px"
          }
        },
        "elements": [
          {
            "instanceOf": "cartesian",
            "props": {
              "style": {
                "height": 250,
                "title": "Revolutions per Minute",
                "legend": true
              }
            },
            "children": [
              {
                "props": {
                  "name": "Revolutions per Minute"
                },
                "metric": {
                  "name": "ugottaride:engine_rpm",
                  "source": "ugottaride",
                  "y": {
                    "type": "value"
                  }
                },
                "type": "LINE"
              }
            ]
          }
        ],

        "instanceOf": "card"
      },

      {
        "props": {
          "title": "Miles Traveled",
          "style": {
            "width": "98.7%",

            "display": "flex",
            "margin-left": "5px",
            "margin-right": "5px",
            "margin-bottom": "5px"
          }
        },
        "elements": [
          {
            "instanceOf": "cartesian",
            "props": {
              "style": {
                "height": 250,
                "title": "Miles Traveled",
                "legend": true
              }
            },
            "children": [
              {
                "props": {
                  "name": "Miles Traveled"
                },
                "metric": {
                  "name": "ugottaride:miles_traveled",
                  "source": "ugottaride",
                  "y": {
                    "type": "value"
                  }
                },
                "type": "LINE"
              }
            ]
          }
        ],
        "instanceOf": "card"
      }
    ],

    "instanceOf": "html"
  }
}![]()
You can copy the examples above and add another Arc Gauge for RPM by creating four new files called driverRpmArcGaugeInspectorWidget.json, driverRpmArcGaugeInspectorWidgetTemplate.json, driverRpmArcGauge.json, and driverRpmArcGaugeTemplate.json under your drivers UI entity.
- Make sure to update the “name”, “minValue” and “maxValue” values of the driverRpmArcGaugeInspectorWidget.json and driverRpmArcGauge.json files.
- You will also need to change the the “name”, “minValue”, “maxValue”, “colorThresholds”, and “fetchValue” values of the driverRpmArcGaugeInspectorWidgetTemplate.json and driverRpmArcGaugeTemplate.json files.
- They should be as follows:
- “name”: “ugottaride:driverRpmArcGaugeInspectorWidget” in the driverRpmArcGaugeInspectorWidget.json file
- “name”: “ugottaride:driverRpmArcGauge” in the driverRpmArcGauge.json file
- “name”: “ugottaride:driverRpmArcGaugeInspectorWidgetTemplate” in the driverRpmArcGaugeInspectorWidgetTemplate.json file
- “name”: “ugottaride:driverRpmArcGaugeTemplate” in the driverRpmArcGaugeTemplate.json file
- “maxValue”: 8000
- “minValue”: 0
- “fetchValue”: “metrics(ugottaride:engine_rpm, ugottaride).value”
- “colorThresholds”: [0,5500,6700]