Sparkgraphs
![]()
Adding Sparkgraphs to Gridview
Revitalizing your user interface with Sparkgraphs provides a unique visual perspective for presenting your data.
Examples
![]()
Add Sparkgraph JSON File to you solution
- In your code editor, navigate to objects -> dashui
- Add a new folder named common
Add a new file named sparkgraph.json
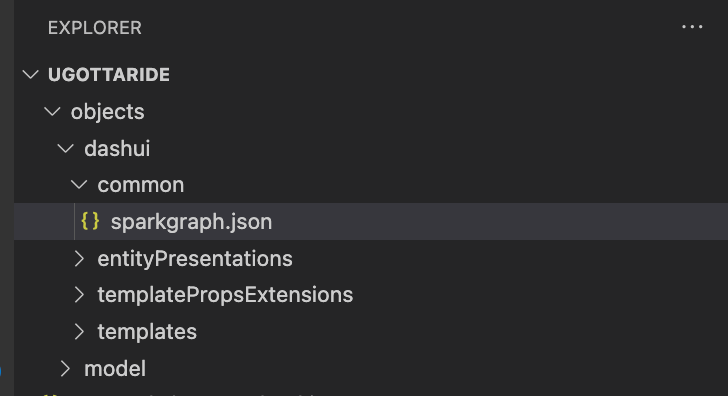
copy the code below into your sparkgraph.json file
{
"kind": "template",
"name": "ugottaride:sparkgraph",
"view": "default",
"target": "*",
"preprocess": "$ ~> | elements[0].elements | { \"content\": $props.headline } | ~> | elements[1].elements | {\"path\": $props.additionalInformation.path, \"branches\": $props.additionalInformation.branches, \"defaultElements\": $props.additionalInformation.defaultElements } | ~> | elements[2] | { \"path\": $props.graph.path, \"source\": $props.graph.source, \"baseline\": $props.graph.baseline } |",
"element": {
"instanceOf": "html",
"style": {
  "marginBottom": 16
},
"elements": [
  {
    "instanceOf": "headline",
    "grade": "grid",
    "elements": {
      "instanceOf": "text"
    }
  },
  {
    "instanceOf": "html",
    "style": {
      "fontFamily": "Roboto,Helvetica Neue,Helvetica,Arial,sans-serif",
      "fontSize": "13px",
      "fontWeight": "400",
      "lineHeight": "15px",

      "marginTop": 8
    },
    "elements": {
      "instanceOf": "select"
    }
  },
  {
    "instanceOf": "sparkGraph",
    "style": {
      "height": 80,
      "width": 250
    },
    "y": {
      "maximumFractionDigits": 2

    }
  }
]
}
}
![]()
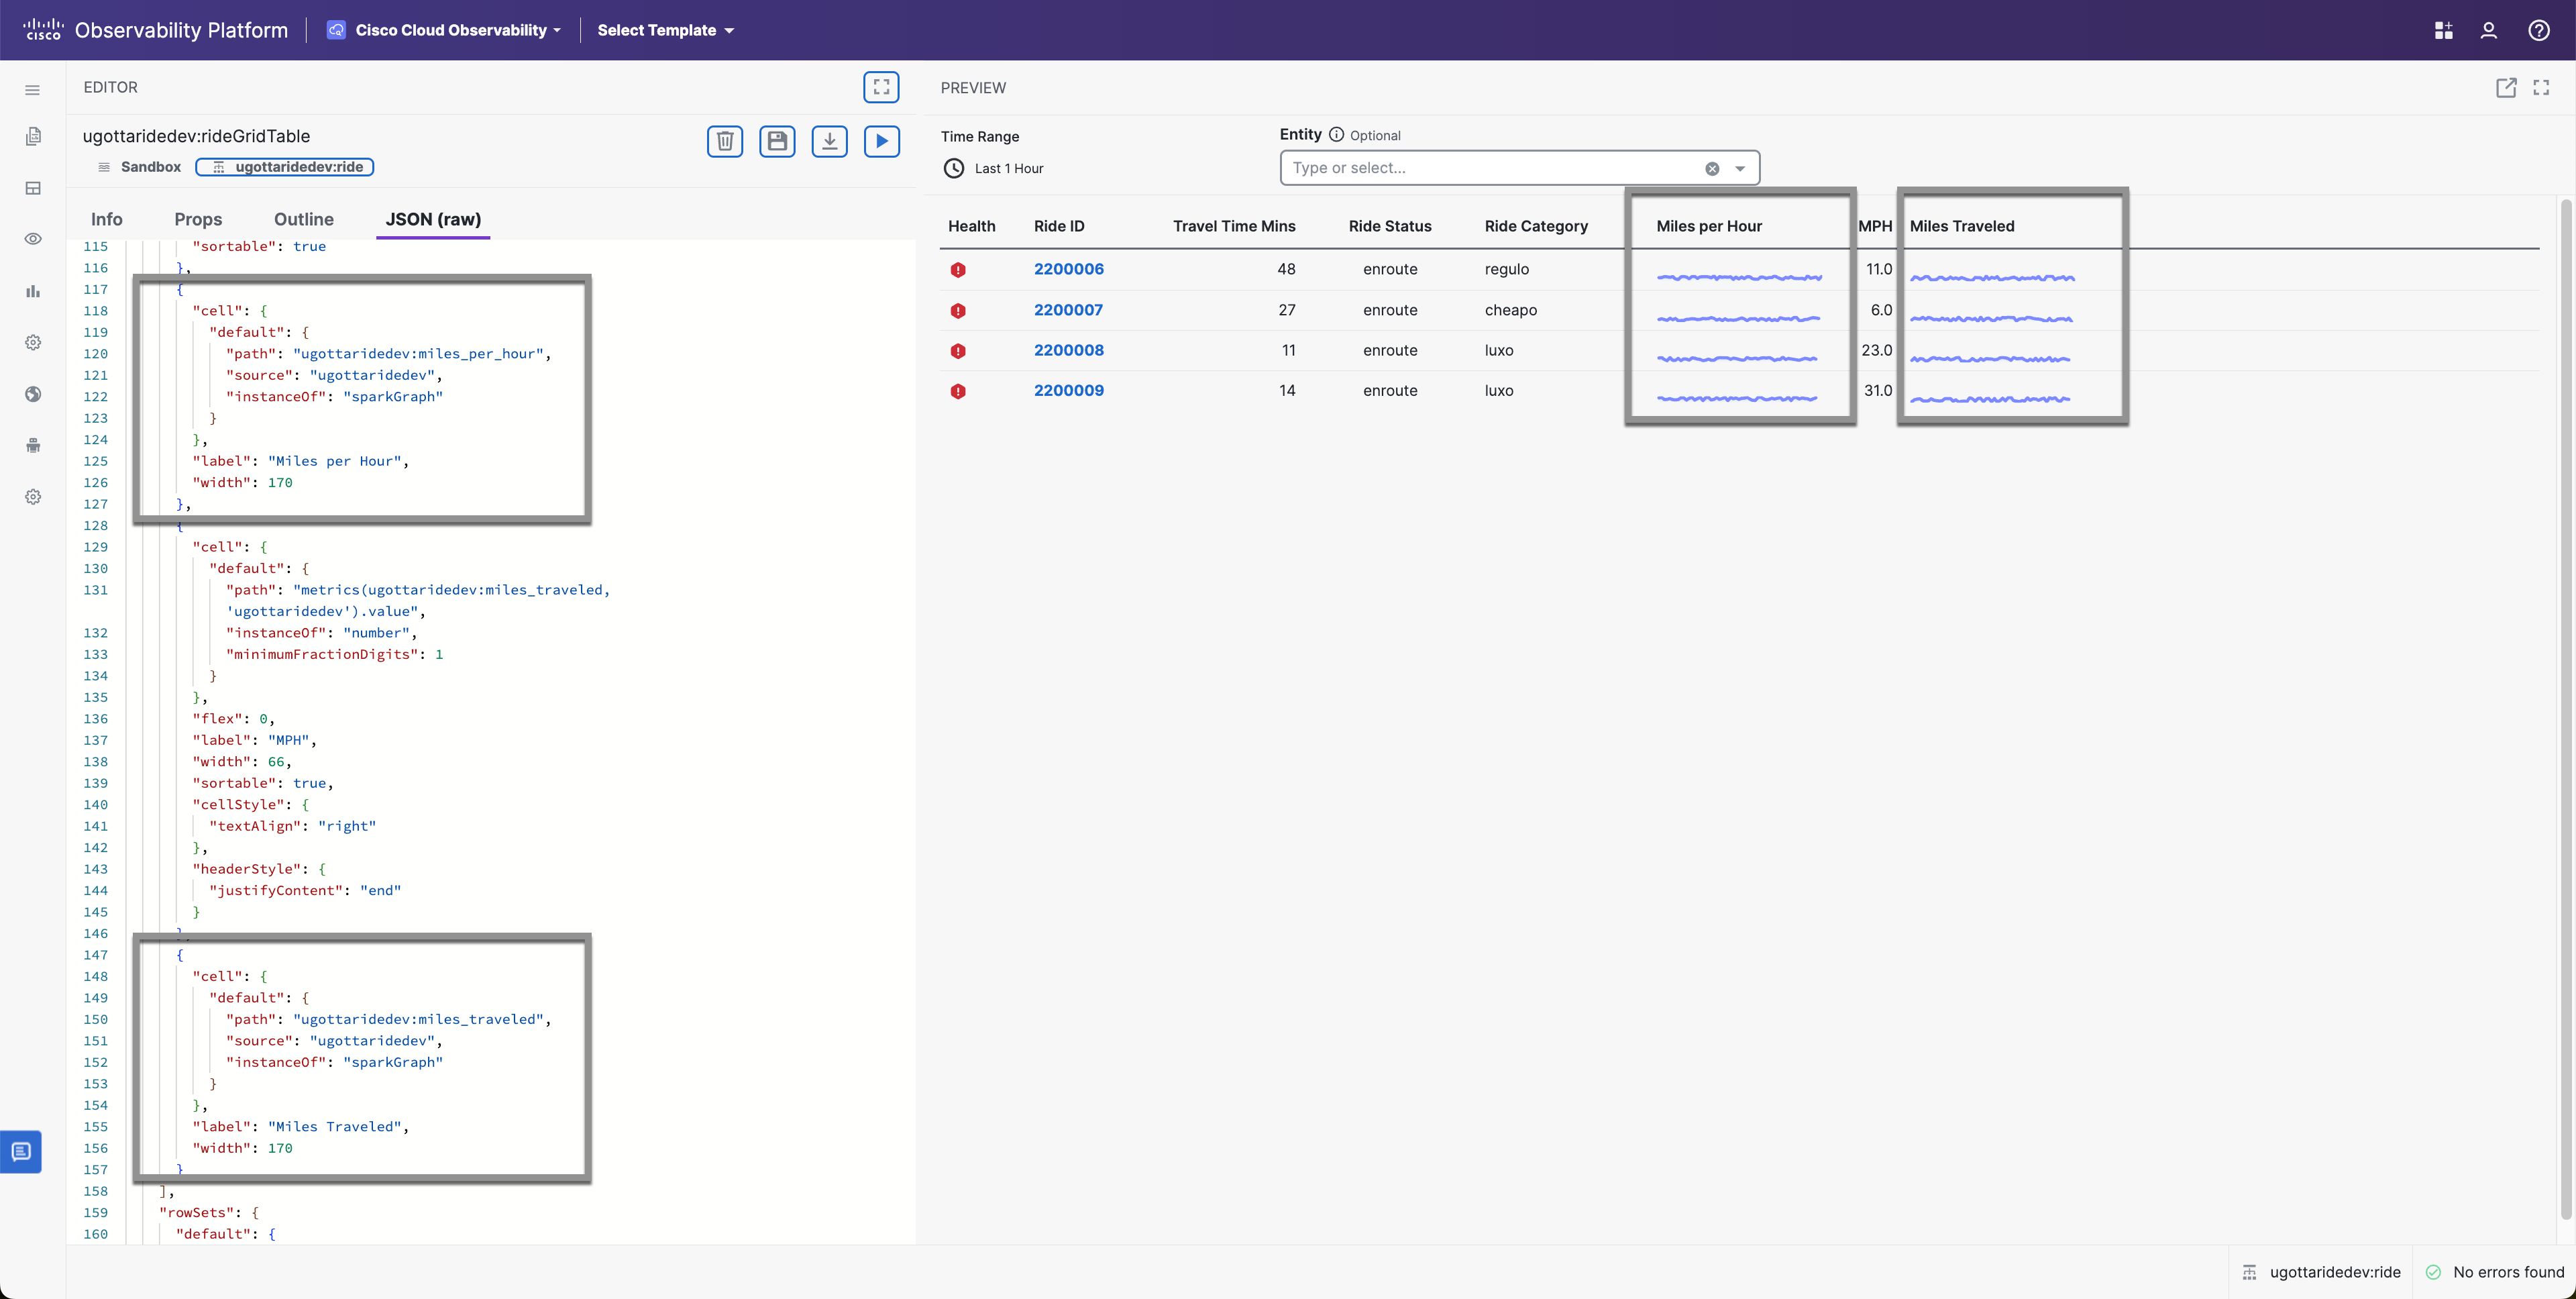
Add MPH Sparkgraph Ride Grid Table
- In your code editor, navigate to the rideGridTable.json that we created earlier
- Add a new column after the Ride Category column
- In the Columns cell add
- “path”: “ugottaride:miles_per_hour”,
- “source”: “ugottaride”,
- “instanceOf”: “sparkGraph”
- “label”: “Miles per Hour”,
- “width”: 170
In the rideGridTable json file, you will add a new column to display the MPH Sparkgraph as seen on lines between the
            {
                "label": "Ride Category",
                "flex": 0,
                "width": 160,
                "cell": {
                    "default": {
                        "instanceOf": "tooltip",
                        "truncate": true,
                        "trigger": {
                            "instanceOf": "string",
                            "path": [
                                "attributes(ride_category)"
                            ]
                        }
                    }
                }
            },
            <Start>
            {
                "label": "Miles per Hour",
                "width": 170,
                "cell": {
                    "default": {
                    "path": "ugottaride:miles_per_hour",
                    "source": "ugottaride",
                    "instanceOf": "sparkGraph"
                    }
                },
            },
<End>![]()
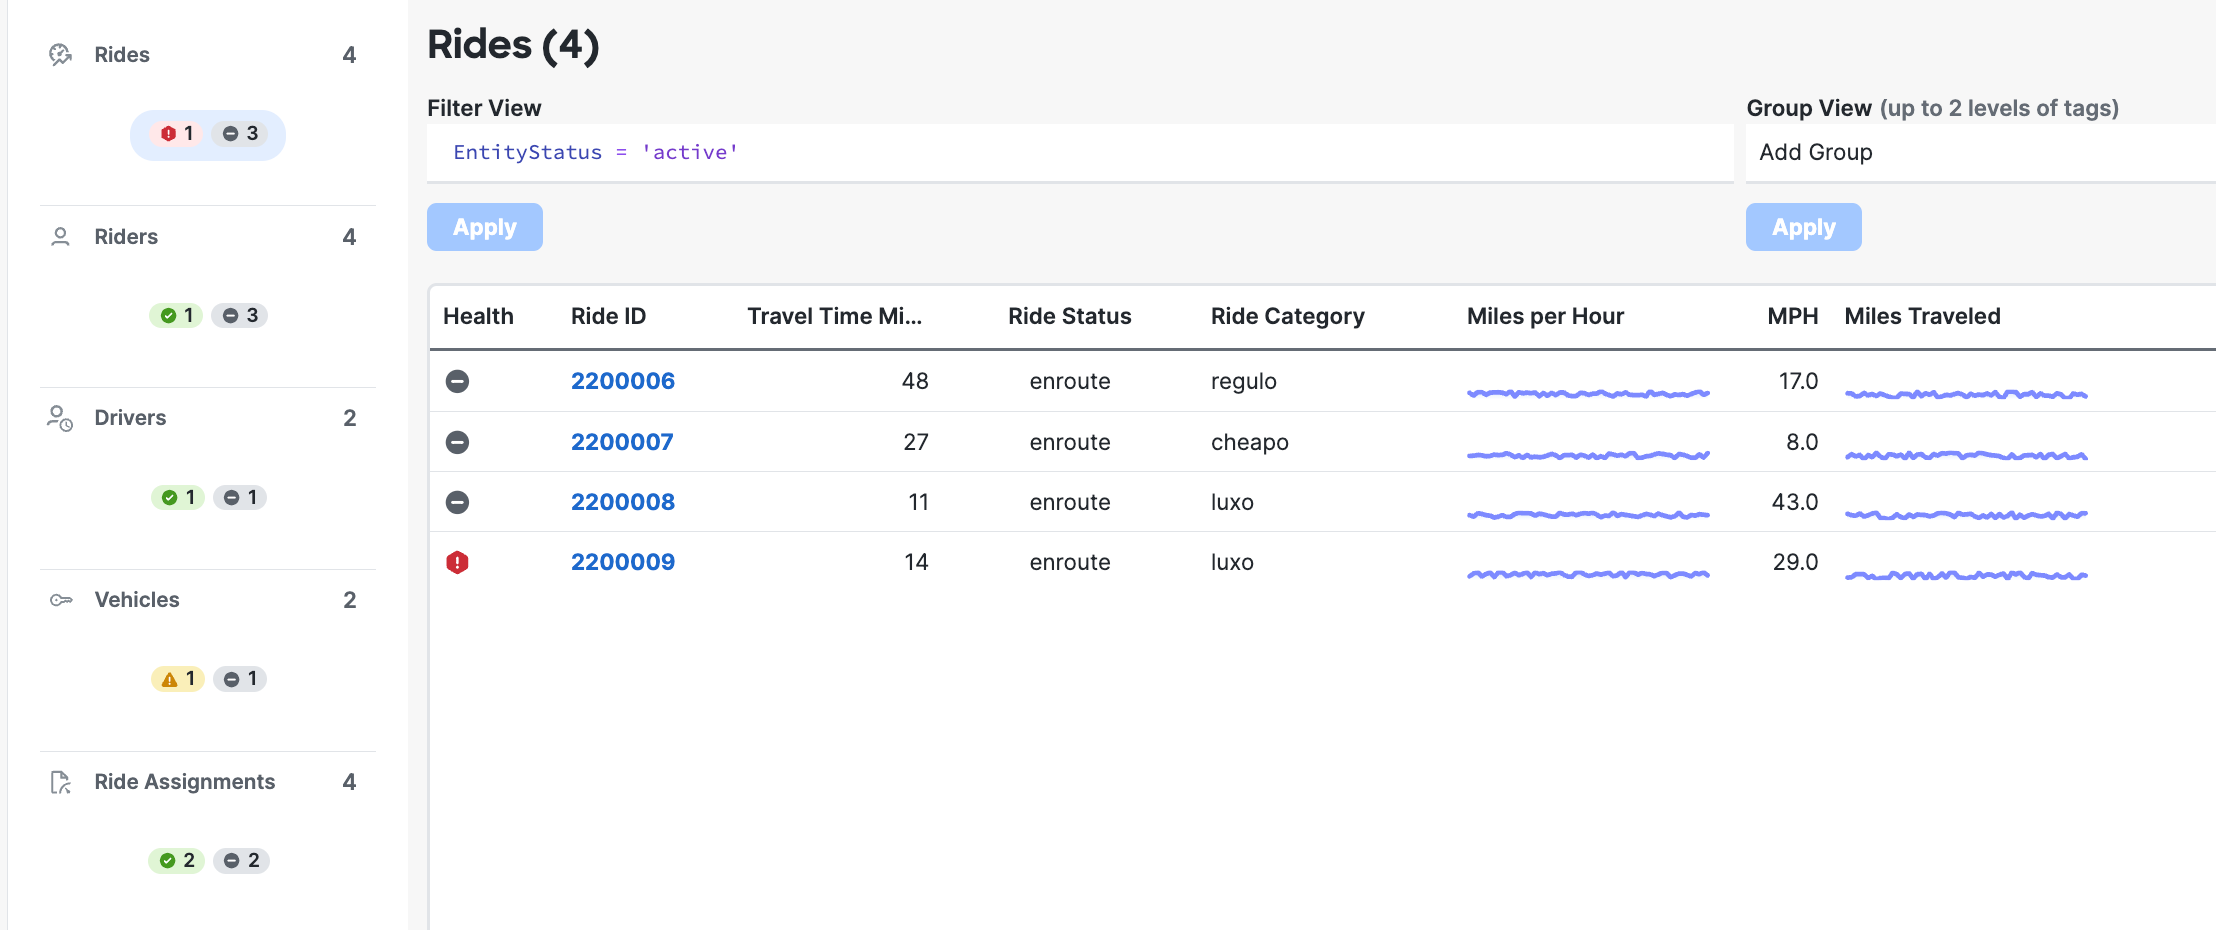
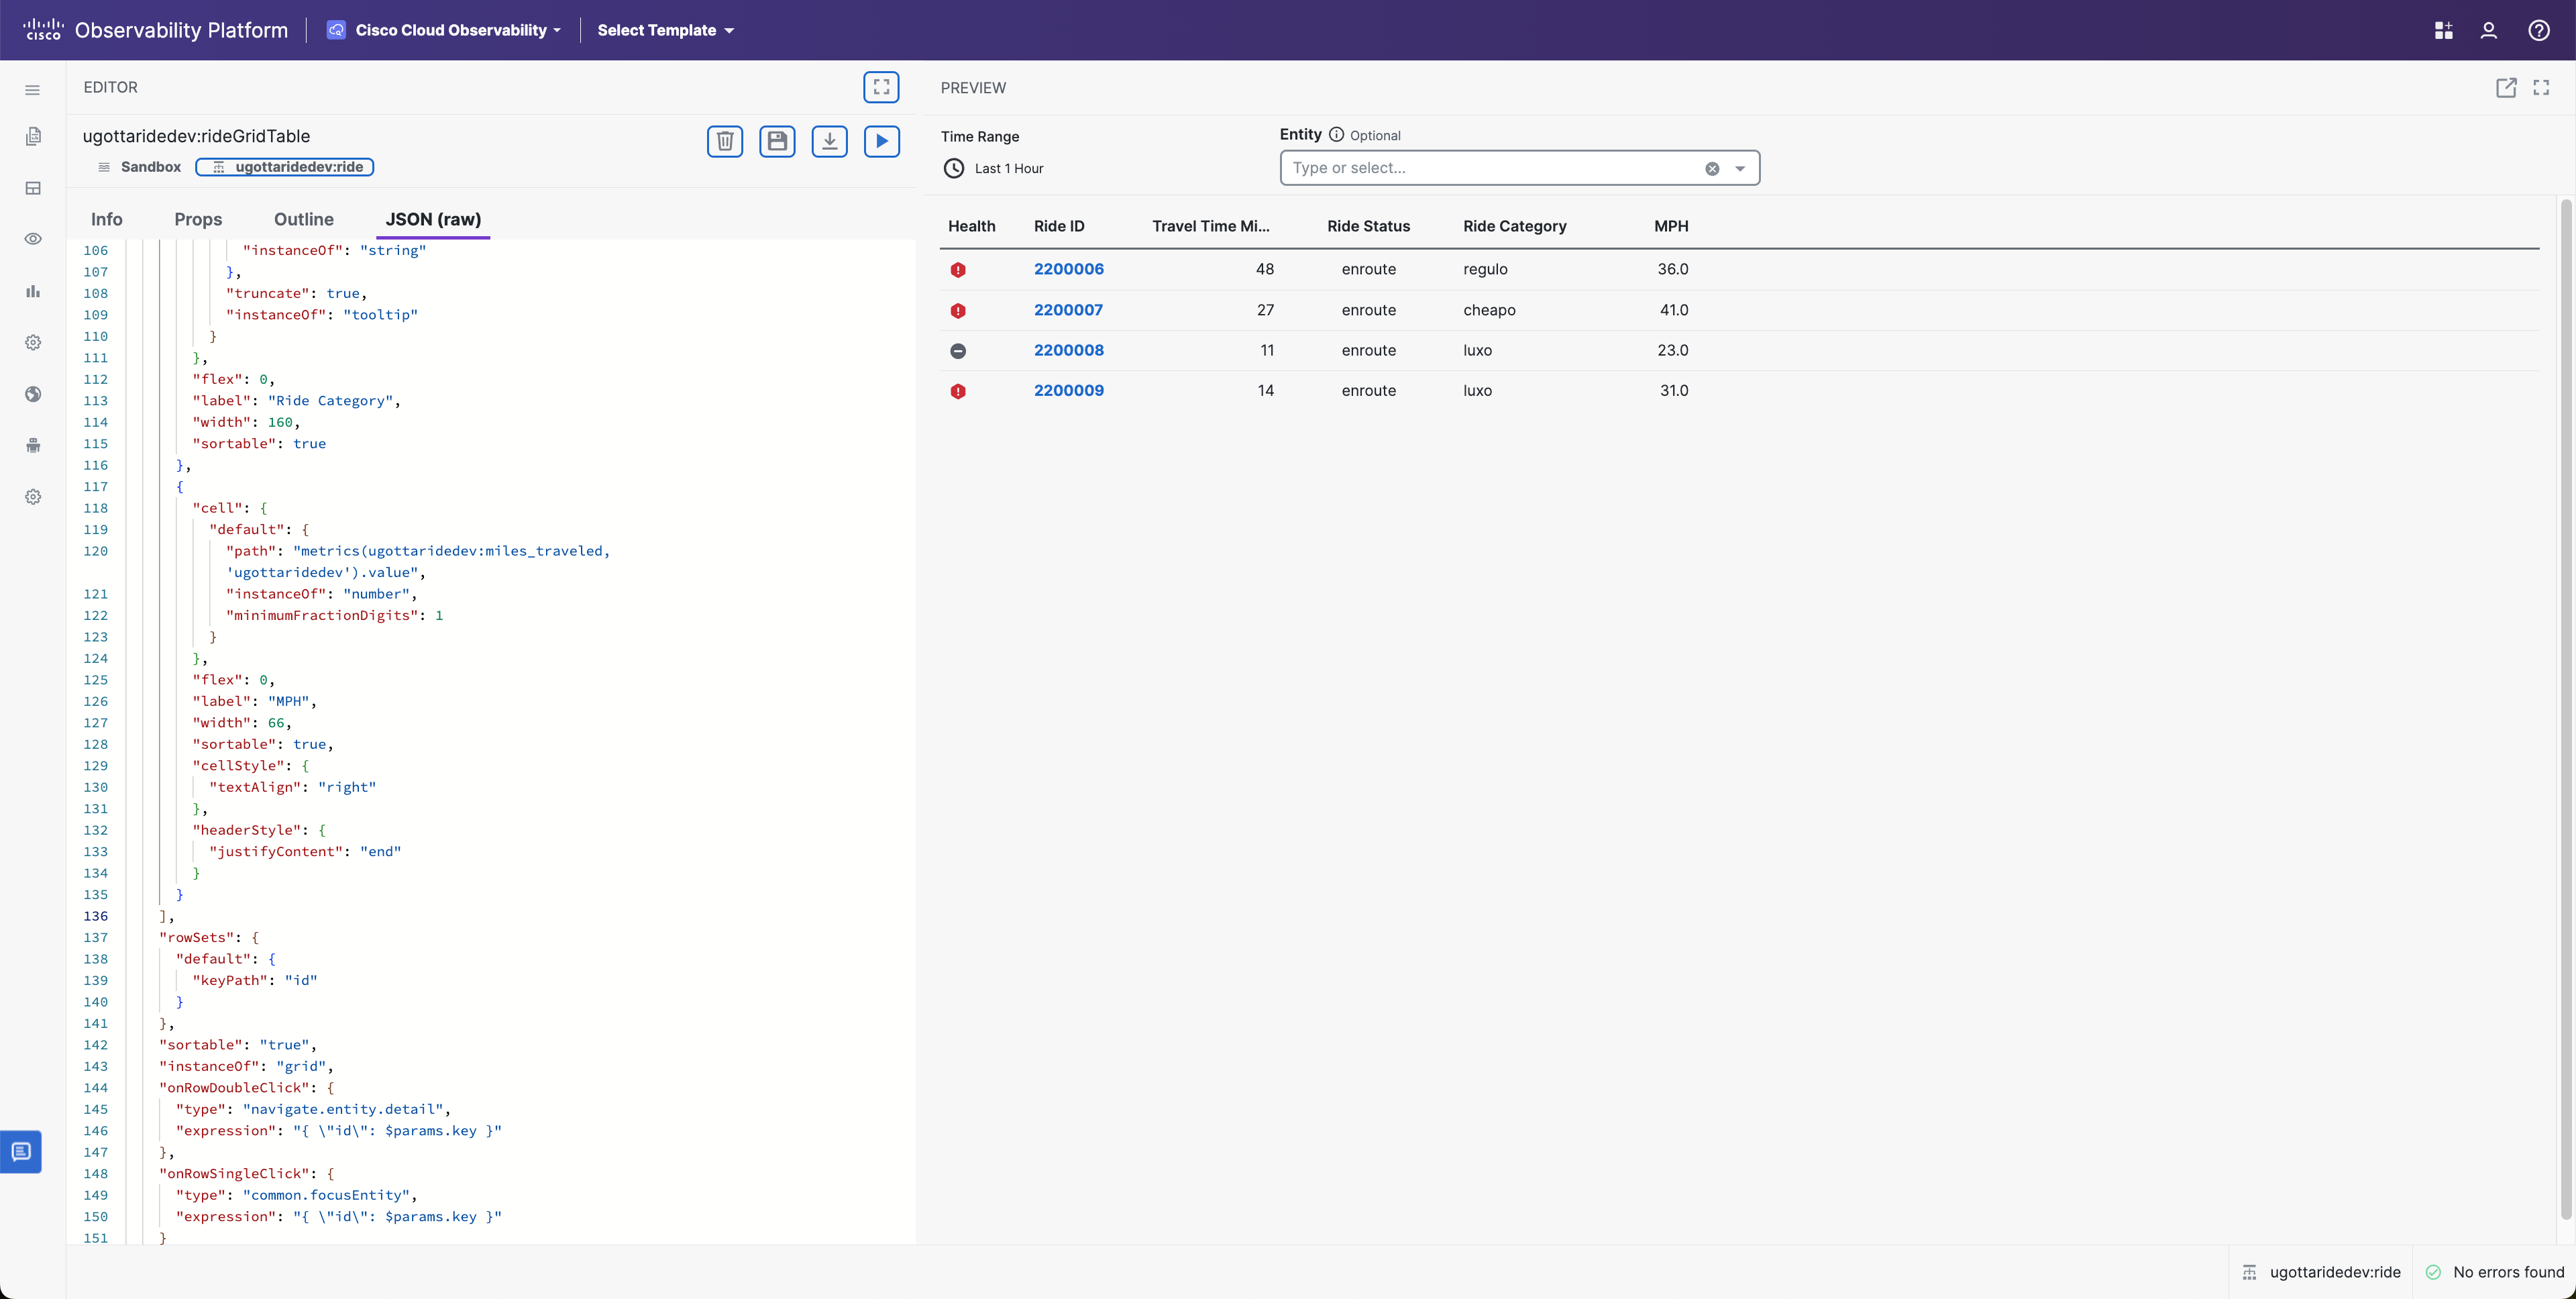
Before and After
Before applying these modifications to your solution, you have the option to validate them in the Authoring Tool.
Before:
 After: