Gridview Metrics
![]()
Adding Metrics to Gridview
Enhancing your entities’ gridview with metrics offers valuable insights into grid-related metrics and expands your capacity to showcase additional data.
Examples
![]()
Adding MPH to the Ride Grid Table
- In your code editor, navigate to the rideGridTable.json that we created earlier
- Add a new column after the Ride Category column
- In the Columns cell add
- “path”: “metrics(ugottaride:miles_traveled, ‘ugottaride’).value”,
- “instanceOf”: “number”
- “minimumFractionDigits”: 1
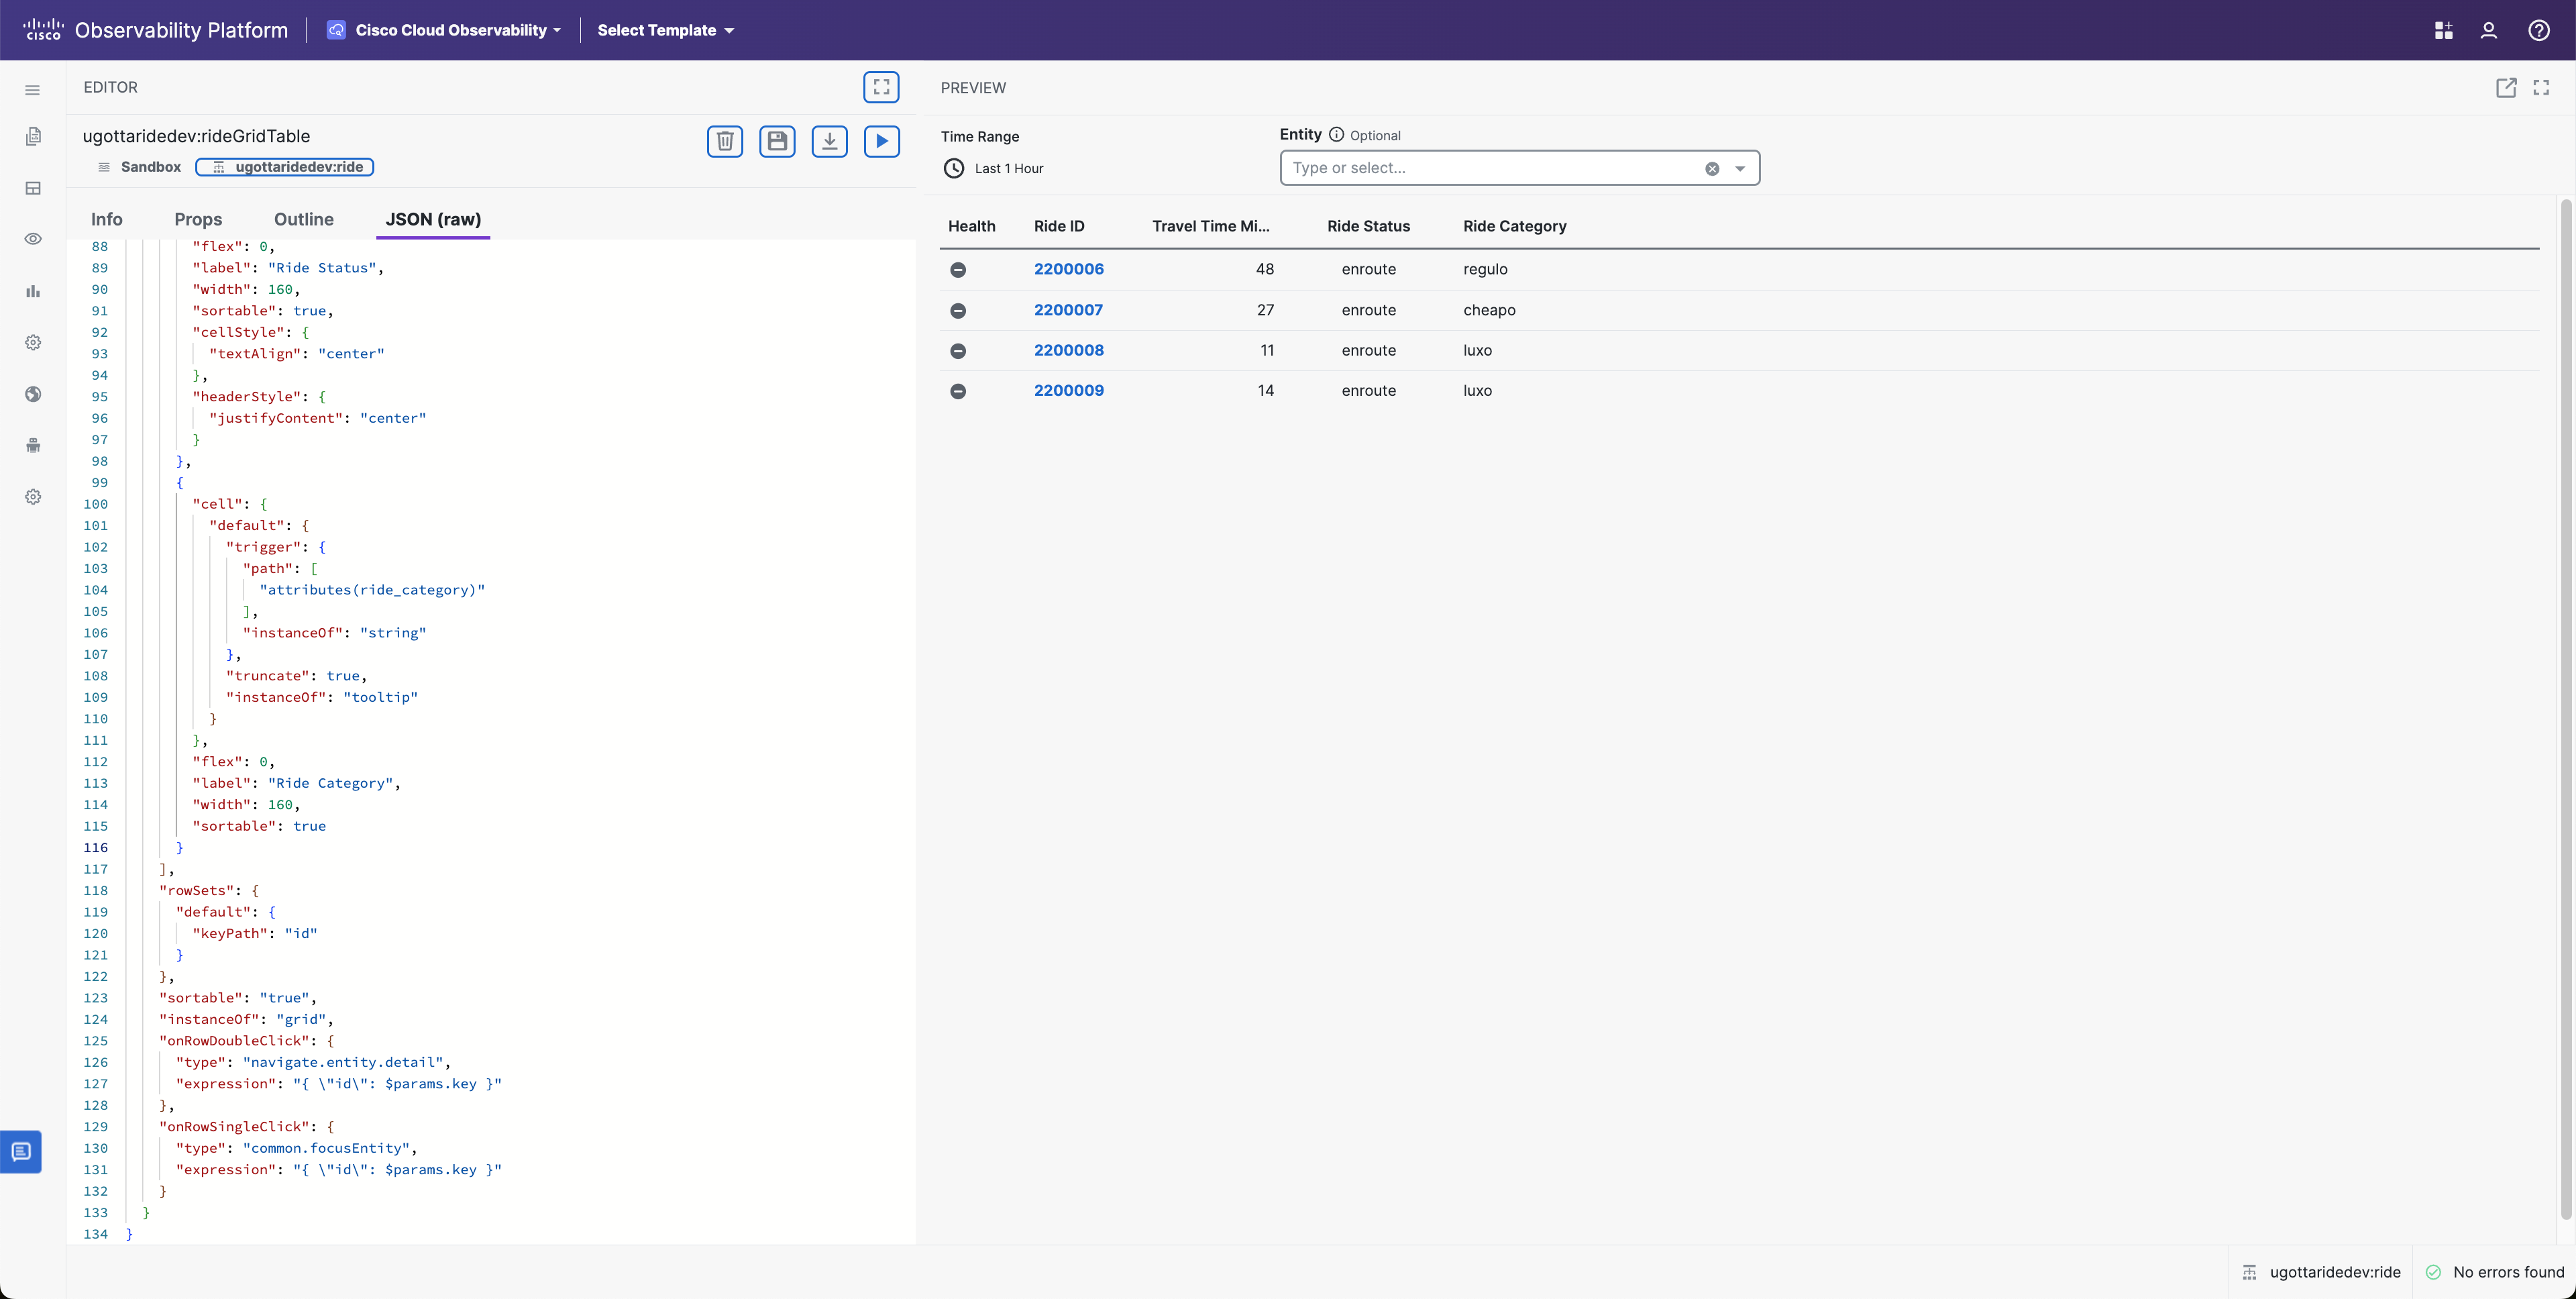
In the rideGridTable json file, you will add a new column to display MPH metrics as seen on lines between the
{
"label": "Ride Category",
"flex": 0,
"width": 160,
"cell": {
"default": {
"instanceOf": "tooltip",
"truncate": true,
"trigger": {
"instanceOf": "string",
"path": [
"attributes(ride_category)"
]
}
}
}
},
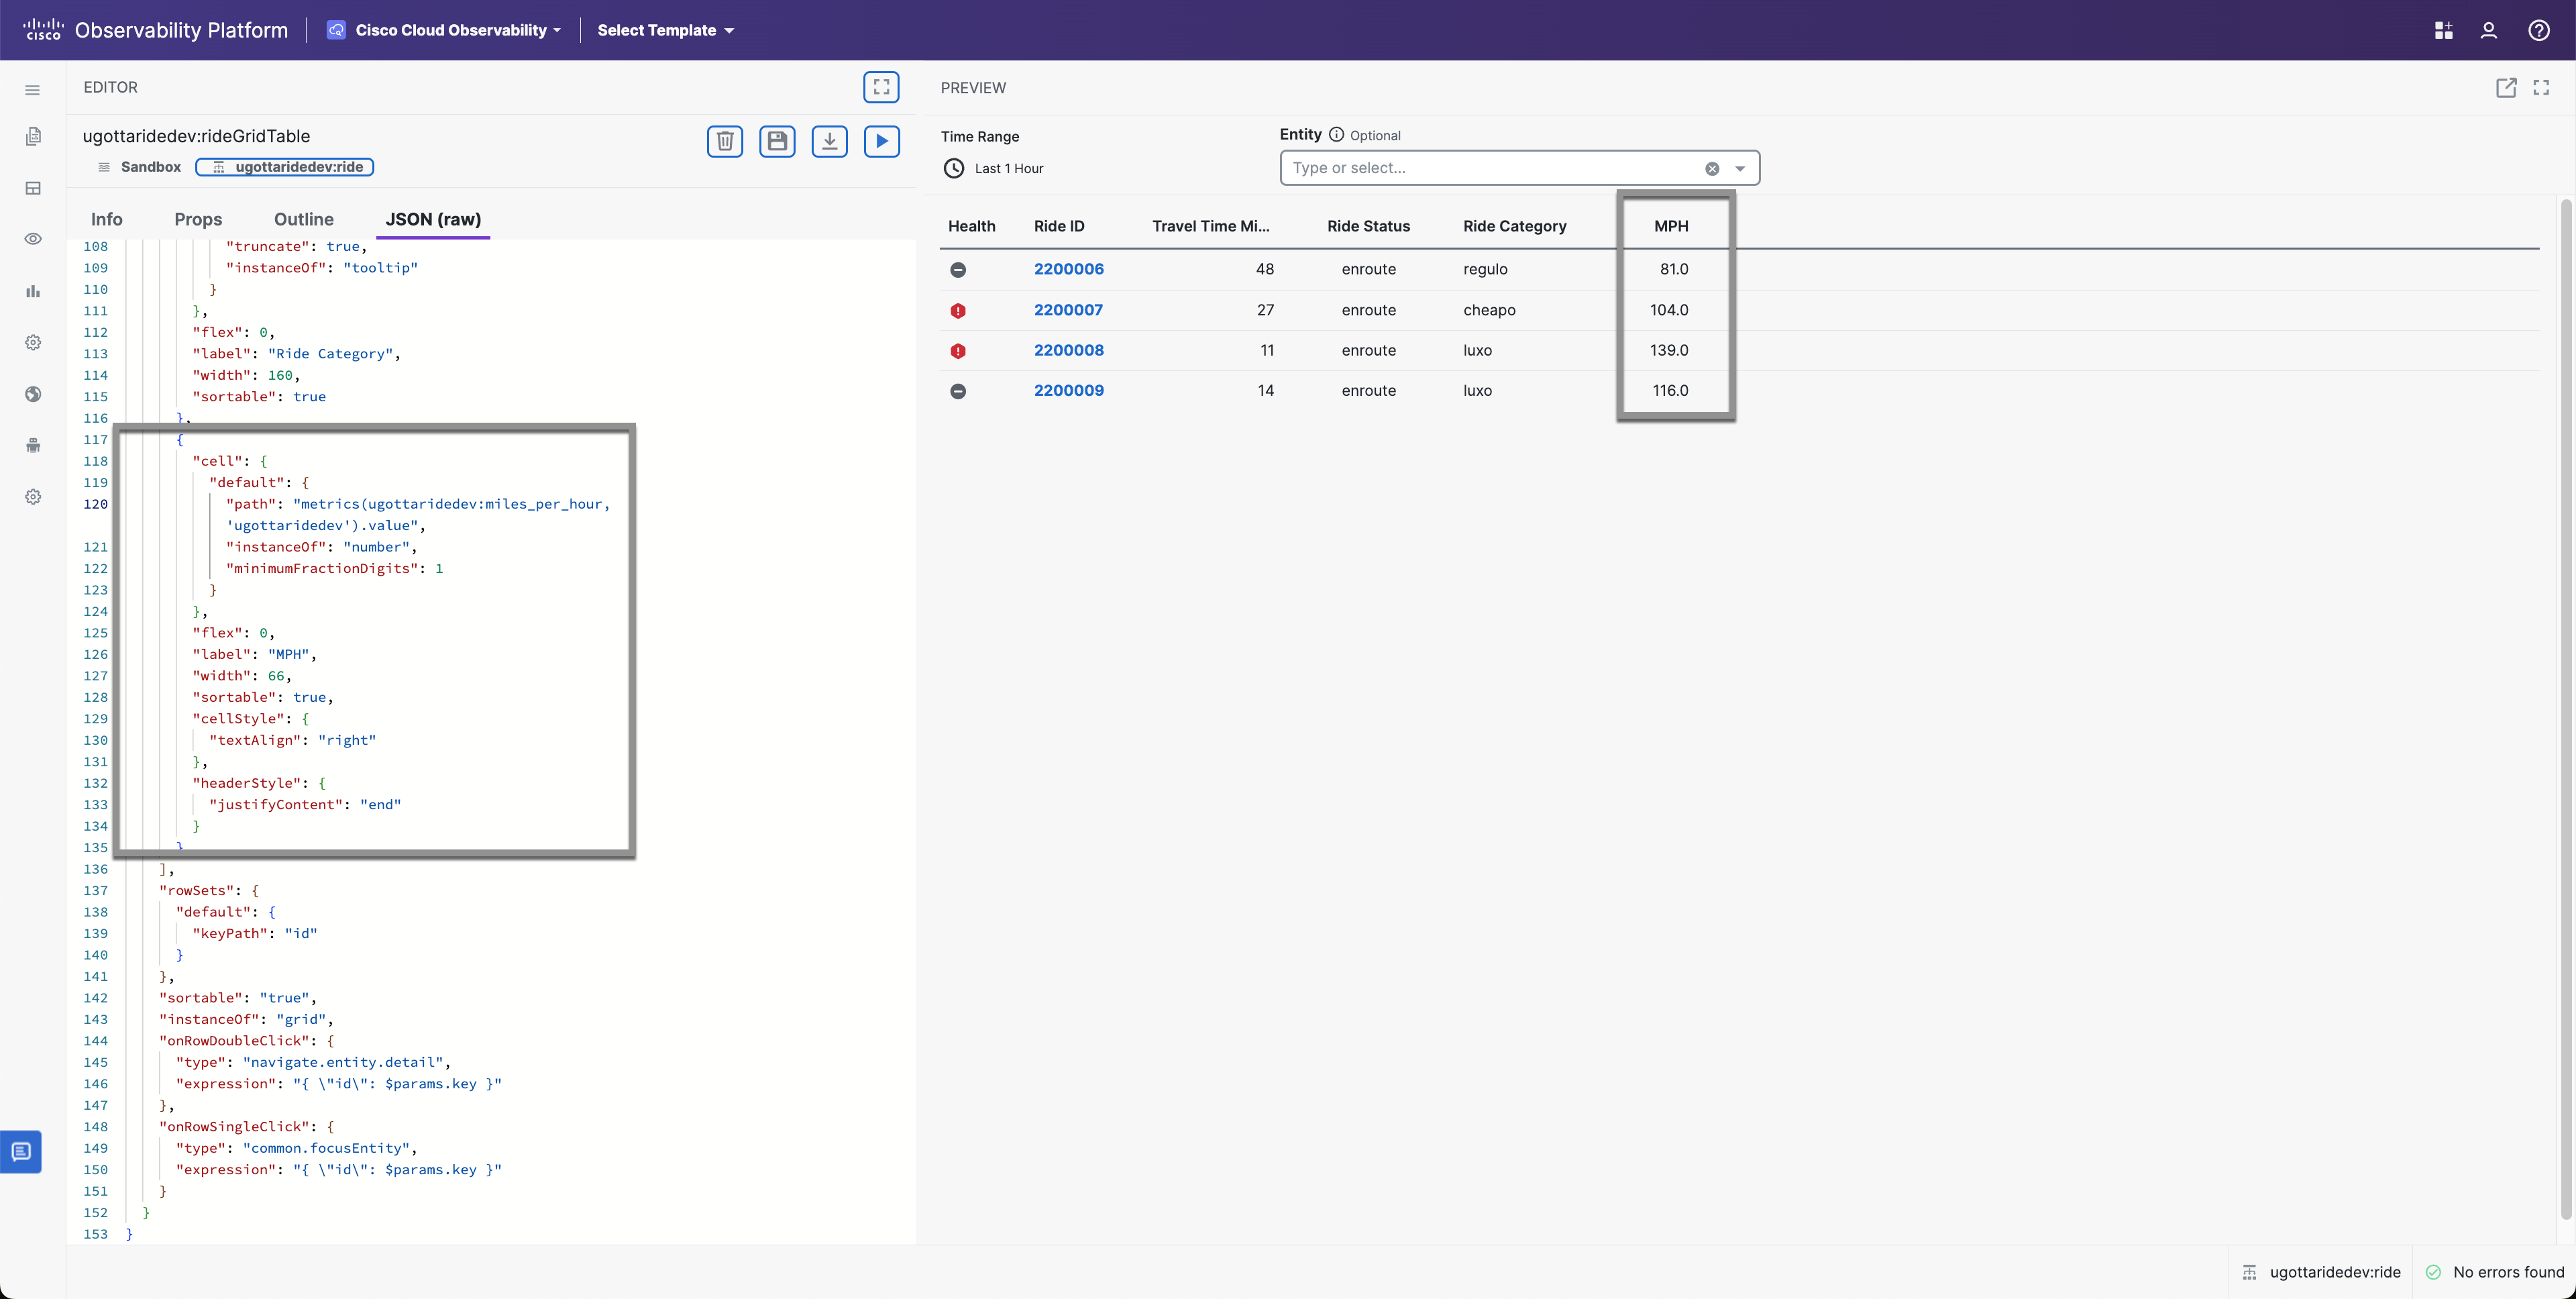
<Start>
{
"label": "MPH",
"flex": 0,
"width": 66,
"cell": {
"default": {
"path": "metrics(ugottaride:miles_per_hour, 'ugottaride').value",
"instanceOf": "number",
"minimumFractionDigits": 1
}
},
"sortable": true,
"cellStyle": {
"textAlign": "right"
},
"headerStyle": {
"justifyContent": "end"
}
}
<End>![]()
Before and After
Before applying these modifications to your solution, you have the option to validate them in the Authoring Tool.
Before:
 After: